Feeds:
Posts
Comments

Archive for the ‘Real Estate Statistics’ Category

Canadian home sales reached an all-time monthly high in September, while the supply of houses listed for sale declined to a record low. According to statistics released on October 15 by the Canadian Real Estate Association (CREA), national MLS® home sales rose by an additional 0.9% in September. Sales activity was up 45.6% year-over-year. Meanwhile, the inventory of homes listed for sale declined to the lowest level on record, spurring high competition for available listings. The national average sale price topped the $600,000 mark for the first time in history.

While similar trends are found in the majority of Canadian markets, bear in mind that this is the national picture. For a closer look at real estate sales and pricing in your local market, contact Earl Taylor, your local Coldwell Banker professional.

Read Full Post »

As expected during the pandemic, Canadian MLS® home sales fell sharply in April, according to statistics issued by the Canadian Real Estate Association (CREA). But while the number of transactions declined last month, sale prices have held relatively steady in markets across the country.

The national average price for homes sold in April was $488,000, down only slightly by 1.3% from the same month last year. Excluding Canada’s most active and expensive markets, Greater Vancouver and Greater Toronto, the national average reduces to $392,000, says CREA.

Of course, this is just ‘the big picture’ on the national front. Home prices can vary dramatically between regions, within neighbourhoods and even on the same street. For a detailed look at resale prices in your area, contact Earl Taylor – Broker, your local Coldwell Banker professional.

Read Full Post »

Read Full Post »

London, ON – London and St. Thomas Association of REALTORS (LSTAR) announced 603 homes* were sold in February, up 5.6% over February 2018. The number of home resales was right on par with the 10-year average. Two months into 2019, there have been 1,128 home resales, up 10.8% compared to the same time last year.

Across the five major areas of LSTAR’s region, average home sales price continued to make healthy gains. The largest year-over-year gain was in Elgin County, with a February average sales price of $360,800, up 33% compared to February 2018. Meanwhile, in London, the February average sales price was $405,186, up 13.5% from the same month last year. The average sales price for the entire LSTAR jurisdiction was $393,911, up 12.5% compared to February 2018.

Area                   Average Sale Price
Elgin County                $360,800
London                         $405,186
Middlesex County      $469,094
St. Thomas                   $306,279
Strathroy                     $365,534
LSTAR                           $393,911

“It’s important to point out that the average sales price does include all housing types, including single detached homes, as well as high rise apartment condominiums,” said Earl Taylor, 2019 LSTAR President. “All real estate is local, so your best source for information on the marketplace is going to come from a professional REALTOR.”

Looking closer at London, which generated the most sales activity in February, there were some interesting findings based on housing type.

“The average sales price for a 2-storey home in London was $543,114, up 12.7% from February 2018,” Taylor said. “In comparison, the average sales price for a high rise apartment condominium was $246,070, up 27.1% compared to the same month in 2018. And the average sales price for a 1-storey home (bungalow or ranch style) was $368,664, up 8.9%, compared to February 2018.”

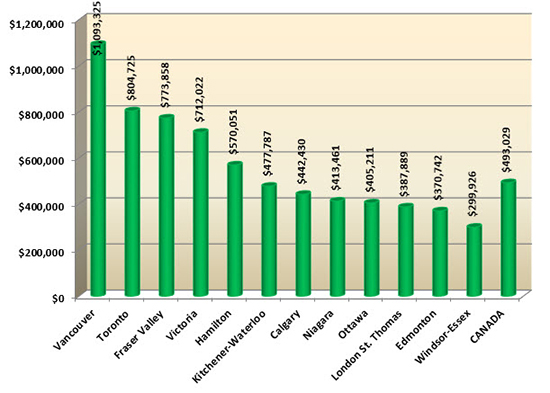
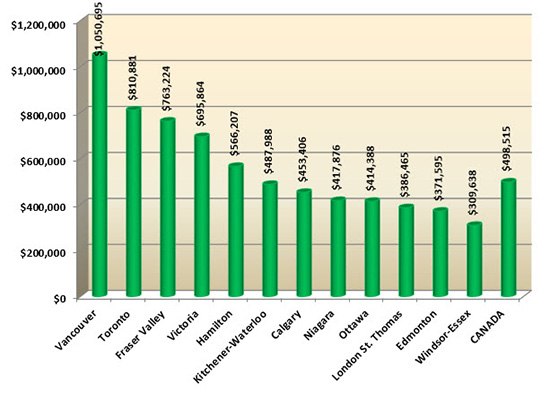
The following table** is based on data taken from the CREA National MLS Report for January 2019 (the latest CREA statistics available). It provides a snapshot of how average home prices in London and St. Thomas compare to other major Ontario and Canadian centres.

City                              January Average Sale Price
Vancouver                          $1,003,104
Toronto                               $782,944
Fraser Valley                     $666,740
Victoria                               $661,307
Hamilton                             $572,559
Kitchener-Waterloo          $485,408
Calgary                                $449,901
Niagara                               $417,052
Ottawa                                $407,820
London St. Thomas          $392,191
Edmonton                          $347,166
CANADA                             $471,112

According to a research report[1], a total of $67,425 in ancillary expenditures is generated by the average housing transaction in Ontario over a period of three years from the date of purchase. “When you look at the first two months of the year, that’s generating potentially more than $76 million into the economy,” Taylor said. “We cannot underestimate the financial impacts of the business of real estate. It touches everyone in the community, our local businesses, shopping centres, schools and government services.”

The London and St. Thomas Association of REALTORS (LSTAR) exists to provide its REALTOR Members with the support and tools they need to succeed in their profession. LSTAR is one of Canada’s 15 largest real estate associations, representing over 1,700 REALTORS working in Middlesex and Elgin Counties, a trading area of 500,000 residents. LSTAR adheres to a Quality of Life philosophy, supporting growth that fosters economic vitality, provides housing opportunities, respects the environment and builds good communities and safe neighbourhoods and is a proud participant in the REALTORS Care Foundation’s Every REALTOR Campaign.

*These statistics are prepared for LSTAR by the Canadian Real Estate Association (CREA) and represent a data snapshot taken on March 1, 2019, based on processed home sales activity between February 1 and 28, 2019.

**LSTAR usually includes Windsor-Essex in the CREA table, but January data was not available.

Read Full Post »

January 3, 2019

London and St. Thomas Association of REALTORS® (LSTAR) announced 439 homes* were sold in December, up 2.1% over December 2017 and right on par with the 10-year average. The number of home resales for the year was 9,799, down 13.3% compared to 2017, which set a record year for residential real estate.

“One of the trends that stood out in December was the sales-to-new listings ratio, which was 108.1% across the region,” said Jeff Nethercott, 2018 LSTAR President. “It’s a statistic the Canadian Real Estate Association (CREA) says represents conditions in the marketplace that favour sellers (a ratio between 40% and 60% is generally consistent with a balanced market). In London, the sales-to-new listings ratio was 119.7%, while in St. Thomas it was 100.0%.”

December also saw average home sales price make steady gains in LSTAR’s jurisdiction. In London, the average sales price was $375,782, up 13.4% from last December, while it was $304,079 in St. Thomas, an increase of 0.7% from December 2017.

City December Average Sale Price
London $375,782
St. Thomas $304,079

“Looking at specific areas, London South (which also includes data from the west side of the city) had an average sales price of $421,044 in December, up 16.2% compared to the same period last year and achieving its highest average sales price in the last 10 years,” Nethercott said. “In London North, the average sales price was $426,831, up 16.6% from December 2017, while in London East it was $284,100, up 7.0% compared to last December.”

“Overall, it was a very solid year for home resales in London and St. Thomas,” Nethercott said. “The activity in 2018 performed well above the 10-year average, despite the record low inventory levels seen in the marketplace the entire year. As we kick off 2019, I believe home sales will continue to be strong and be a driving force to the local economy.”

The following chart is based on data taken from the CREA National MLS® Report for November 2018 (the latest CREA statistics available). It provides a snapshot of how average home prices in London and St. Thomas compare to other major Ontario and Canadian centres.

Average home prices in Canada at the end of November 2018

According to a research report1, one job is created for every three real estate transactions and approximately $53,000 in ancillary spending is generated each time a home changes hands in Ontario. “We can’t underestimate the impact the business of real estate has on all the communities LSTAR passionately serves,” Nethercott said. “Based on the total home resales for 2018, this translates into creating approximately 3,200 jobs and generating potentially more than $519 million – a half billion dollars – back into the local economy.”

The London and St. Thomas Association of REALTORS® (LSTAR) exists to provide its REALTOR® Members with the support and tools they need to succeed in their profession. LSTAR is one of Canada’s 15 largest real estate associations, representing over 1,700 REALTORS® working in Middlesex and Elgin Counties, a trading area of 500,000 residents. LSTAR adheres to a Quality of Life philosophy, supporting growth that fosters economic vitality, provides housing opportunities, respects the environment and builds good communities and safe neighbourhoods and is a proud participant in the REALTORS Care Foundation’s Every REALTOR™ Campaign.

*These statistics are prepared for LSTAR by the Canadian Real Estate Association (CREA) and represent a data snapshot taken on January 1, 2019, based on processed home sales activity between December 1 and 31, 2018.

Read Full Post »

London and St. Thomas Association of REALTORS® (LSTAR) announced 746 homes* were sold in November, up 6.7% over November 2017. The number of home resales was the second highest total ever for November since LSTAR began tracking data in 1978. November 2016 holds the record with 749 home resales, only three more than November 2018.

“In November, we saw more positive signs with new listings in the marketplace, which contributed to the robust sales activity,” said Jeff Nethercott, 2018 LSTAR President. “November had 898 new listings, an increase of 17.5% over the same month last year. The area of London East continues to be making healthy gains in both new listings and average sales price. It had 192 new listings, up 24.7 % from November 2017, where the average sales price was $302,737, up 18.7% from 2017 and up 58.9% compared to five years ago. Going back further, that’s up 75.0% compared to 10 years ago.”

Average sales price also made steady gains in the major geographic areas in London. In London North, the average sales price was $482,202, up 24.4% from last November and up 62.4% compared to the same month five years ago. It’s an increase of 98.7% compared to the average sales price in 2008.

“Similar to October, we saw inventory (what is called active listings) making slight gains, despite the overall record low inventory that dominated our marketplace this year,” Nethercott said. “Last month, LSTAR’s jurisdiction had 1,391 active listings, up 7.6% from November 2017. The sales-to-new listings ratio was 83.1%, which the Canadian Real Estate Association (CREA) says represents conditions in the marketplace that favour sellers (a ratio between 40% and 60% is generally consistent with a balanced market). Looking at the major centres, St. Thomas had the highest sales-to-new listings ratio at 97.0%.”

A total of 65 homes were sold in November, up 10.2% from November 2017. The average home sales price in St. Thomas was $304,618 up 13.1% from a year ago and up 43.5% compared to five years ago. It’s also up 78.6% from 10 years ago.

The following chart is based on data taken from the CREA National MLS® Report for October 2018 (the latest CREA statistics available). It provides a snapshot of how average home prices in London and St. Thomas compare to other major Ontario and Canadian centres.

Average home prices in Canada at the end of October 2018

According to a research report1, one job is created for every three real estate transactions and approximately $53,000 in ancillary spending is generated each time a home changes hands in Ontario. “It’s turning out to be another exceptional year for real estate across London and St. Thomas,” Nethercott said. “The business of real estate touches every layer of our regional economy, with November resale activity generating potentially more than $39 million and helping create approximately 248 jobs. The impact to economic growth is priceless.”

The London and St. Thomas Association of REALTORS® (LSTAR) exists to provide its REALTOR® Members with the support and tools they need to succeed in their profession. LSTAR is one of Canada’s 15 largest real estate associations, representing over 1,700 REALTORS® working in Middlesex and Elgin Counties, a trading area of 500,000 residents. LSTAR adheres to a Quality of Life philosophy, supporting growth that fosters economic vitality, provides housing opportunities, respects the environment and builds good communities and safe neighbourhoods and is a proud participant in the REALTORS Care Foundation’s Every REALTOR™ Campaign.

*These statistics are prepared for LSTAR by the Canadian Real Estate Association (CREA) and represent a data snapshot taken on December 1, 2018, based on processed home sales activity between November 1 and 30, 2018.


1Economic Impacts of MLS® System Home Sales and Purchases in Canada and the Provinces, Altus Group Consulting, 2013.

Read Full Post »

St Thomas is entering a unique market situation. Currently there are only 62 Residential homes for sale and of these, 9 are under contract. If you are thinking of Selling, we need to talk because the current market is still strong.

The average sale price in St Thomas for October 2018 was $315,464 which is up 11.8% over October 2017. And, this is up 46.8% over October 2013.

If you are looking to Buy, please don’t wait. Lower inventory over the 2018/2019 winter month’s may drive prices higher. The time to act is now – before Christmas.

What should you do? Contact Earl Taylor, your local Real Estate Broker, today – Call or text me at 519-670-9223 and let’s talk.

Checkout my website for more informationMarket Stats Nov 12 2018 pdf1024_1

Read Full Post »

Home sales strong in June, despite inventory challenges

London, ON – London and St. Thomas Association of REALTORS® (LSTAR) announced 1,080 homes* were sold in June, down 14.6% over the same time last year, which saw a record-setting month for June with 1,264 homes sold since the Association began tracking sales data in 1978.

“The home sales in June continue the strong momentum we saw in May, setting the stage for a very robust season for resale homes this summer,” said Jeff Nethercott, 2018 LSTAR President. “Sales activity remains above the 10-year average, as the marketplace continues to manage the lowest inventory levels since 2009. Average home prices are making slight gains all across the region.”

By geographic area, London East made the biggest gains, with the average June sales price at $295,541, up 11.7% from June 2017 and up 34.7% compared to June 2016. London North also saw an increase of 11.6% from June 2017 with an average sales price of $479,237. That’s up 39.9% compared to June 2016. Meanwhile, the average sales price in London South was $372,881, up 9.2 percent from June 2017 and up 36.6% from June 2016.

Overall, the average June sales price in London and St. Thomas was $370,247, up 10.5% from June 2017 and up 32.7% from June 2016. Going further back, it’s a 72.0% increase compared to the average sales price 10 years ago.

“As the average sales price trends upward, inventory continues to decrease,” Nethercott said. “In June, there were 1,779 active listings, down 4.3% from this time last year and down 40.0% from June 2016. The sales-to-new listings ratio was 72.0%, which the Canadian Real Estate Association (CREA) says represents conditions in the marketplace that favour sellers (a ratio between 40% and 60% is generally consistent with a balanced market). So for those considering to sell their home, now would be an optimal time to get in touch with your local REALTOR® who can help you navigate through the process.”

St. Thomas saw a total of 99 homes sold in June, down 9.2% from the same period last year. For inventory, there were 76 active listings, down 32.7% from last June and down 53.1% from June 2016. The average home sales price in St. Thomas was $294,471, up 5.5% from June 2017 and up 25.7% from June 2016.

According to a research report[1], one job is created for every three real estate transactions and approximately $53,000 in ancillary spending is generated every time a home changes hands in Ontario. “The real estate space is a huge catalyst to the economy, generating potentially more than $57 million in June,” Nethercott said. “Helping to create approximately 360 jobs, the business of real estate affects everyone. It’s an integral part of building our local communities and solidifying the long-term growth of the diverse neighbourhoods that our REALTOR® members passionately serve.”   

The London and St. Thomas Association of REALTORS® (LSTAR) exists to provide its REALTOR® Members with the support and tools they need to succeed in their profession. LSTAR is one of Canada’s 15 largest real estate associations, representing over 1,700 REALTORS® working in Middlesex and Elgin Counties, a trading area of 500,000 residents. LSTAR adheres to a Quality of Life philosophy, supporting growth that fosters economic vitality, provides housing opportunities, respects the environment and builds good communities and safe neighbourhoods and is a proud participant in the REALTORS Care Foundation’s Every REALTOR™ Campaign. 

*These statistics are prepared for LSTAR by the Canadian Real Estate Association (CREA) and represent a data snapshot taken on July 1, 2018, based on processed home sales activity between June 1 and 30, 2018.

The following table is based on data taken from the CREA National MLS® Report for May 2018 (the latest CREA statistics available). It provides a snapshot of how average home prices in London and St. Thomas compare to other major Ontario and Canadian centres. City Average Sale
Vancouver $1,056,729
Toronto $759,158
Fraser Valley $702,233
Victoria $687,224
Hamilton $570,373
Kitchener-Waterloo $480,221
Calgary $456,721
Ottawa $407,445
Niagara $401,649
Edmonton $374,948
London St. Thomas $350,537
Windsor-Essex $285,617
CANADA $476,424

Read Full Post »

October home sales remain strong, with year-to-date sales surpassing 10,000 homes

November 2, 2017

The London and St. Thomas Association of REALTORS® (LSTAR) announced 757 homes exchanged hands last month, slightly down 10.2% from the same time a year ago. Year-to-date sales are up 10.6%, with a total of 10,111 homes sold, marking the second consecutive year residential sales have surpassed 10,000 across the region.

The October results mark a new chapter for LSTAR, after launching the CoreLogic Matrix platform as part of the Ontario Collective, a collaborative group of 13 real estate boards and associations across Ontario focused on delivering robust data, tools, and the best available technology to support over 5,000 REALTORS®.

“LSTAR was part of the Collective’s first phase launch of this new enhanced regional MLS® System, supporting our REALTOR® Members to better serve consumers,” said Jim Smith, 2017 LSTAR President. “Along with the launch of Matrix, LSTAR has also upgraded its monthly home statistics reporting, thanks to a collaborative partnership with the Canadian Real Estate Association (CREA).”

The CREA Residential Market Activity Report provides more data, featuring an in-depth look at home sales trends happening across London and St. Thomas.

“LSTAR has been working with CREA over the last few months to develop this report and we are very excited to share the data with our Members and the public,” Smith said. “The CREA report includes more specific residential activity based on geography and more detailed comparison statistics to activity in previous years.”

In October, the average sales price across London and St. Thomas was $325,331 up 14.2% from the same time a year ago. The average year-to-date sales price was $330,497 up 18.3% from October 2016.

“When looking at the region, home sales in London East, London South and London North have posted healthy gains in year-to-date activity,” Smith said. “In London East, home sales are up 21.2% compared to a year ago, while in London South, sales are up 13.9% and in London North, sales are up 6.5% compared to this time last year.”

In October, there were 847 listings, down 17% from the same time in 2016.

St. Thomas saw a total of 67 homes sold, down 21.2% from the same time last year. The average home price in St. Thomas was $284,344 up 25.7% from October 2016.

The following chart is based on data taken from the CREA National MLS® Report for September 2017 (the latest CREA statistics available). It provides a snapshot of how average home prices in London and St. Thomas compare to other major Ontario and Canadian centres.

According to a research report1, one job is created for every three real estate transactions and approximately $53,000 in ancillary spending is generated every time a home changes hands in Ontario. “Based on the monthly total for October, that translates into creating approximately 252 jobs and positioning us to potentially generate more than $40 million back into the local economy,” Smith said.

The London and St. Thomas Association of REALTORS® (LSTAR) exists to provide our REALTOR® Members with the support and tools they need to succeed in their profession. LSTAR is one of Canada’s 15 largest real estate associations, representing over 1,700 REALTORS® working in Middlesex and Elgin Counties, a trading area of 500,000 residents. LSTAR adheres to a Quality of Life philosophy, supporting growth that fosters economic vitality, provides housing opportunities, respects the environment and builds good communities and safe neighbourhoods and is a proud participant in the REALTORS Care Foundation’s Every REALTOR™ Campaign.

*These statistics are prepared for LSTAR by the Canadian Real Estate Association (CREA) and represent a data snapshot taken on November 1, 2017, based on reported sales activity between October 1 and 31, 2017.


Read Full Post »

Home Sales Remain Steady in September, with Year-to-Date Sales Surpassing 9,000 Homes

The London and St Thomas Association of REALTORS® (LSTAR) announced 802 homes exchanged hands last month, marking the third consecutive year that more than 800 homes were sold in the month of September*.

“Home sales are slightly down compared to last September, but we are still on track to achieve a record sales year for 2017,” said Jim Smith, 2017 LSTAR President. “We’re experiencing activity that signifies a more balanced marketplace, and expect a strong finish to the year.”

In September, a total of 646 detached homes were sold, a decrease of 9.8% from the previous year, while condominium sales were up 4.0% from 2016, with 156 units sold. The average sales price across London and St. Thomas was $318,347 slightly down 1.0% from the previous month. The average year-to-date sales price was $328,759, up 17.8% from the 2016 average home price of $279,057.

“The activity echoes what’s happening in many other parts of the country,” Smith said. “According to the Canadian Real Estate Association (CREA), there was a roughly even split of local markets where sales posted a slight decline and others saw a slight increase. I want to stress our region’s marketplace continues to be healthy, and your best source to help you navigate what’s trending is a local REALTOR®.”

In September, there were 1,026 listings, up 3.3% from the same time in 2016. The year-to-date sales are ahead by 13.1%, with a total of 9,219 homes sold.

St. Thomas saw a total of 71 homes sold, up 6.0% from the same time last year. The average home price in St. Thomas was $272,251 slightly up 0.6% from the previous month.

The best-selling house style in September in LSTAR’s jurisdiction continues to be the two-storey, followed by the bungalow and ranch. The average price for a detached home in September was $337,574 down 1.7% from the previous month, while the average price for a condominium was $238,730 up 2.0% from September 2016.

According to a research report1, one job is created for every three real estate transactions and approximately $53,000 in ancillary spending is generated every time a home changes hands in Ontario. “Based on the monthly total for September, that translates into creating approximately 267 jobs and positioning us to potentially generate more than $42 million back into the local economy,” Smith said.

*These statistics represent a data snapshot taken on October 1, 2017, based on reported sales activity between September 1 and 30, 2017

Read Full Post »

Older Posts »